| Home > The Scientists > Adam Steer | |||||||||||||||
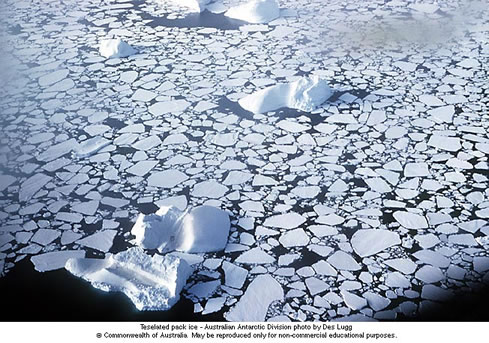
After completing his degree he worked for six months as a teaching assistant at the Canberra Institute of Technology, teaching year 10-12 science to students from all walks of life – from misguided teenagers to middle-aged school re-entrants. From there, Adam spent two years travelling in Canada, Germany and Scotland, which sparked a new curiosity for the world of rocks, trees and other wild things. Which lead him to where he is now… “Antarctica has always fascinated me, since I spend a lot of my spare time playing around rocks, snow and ice”. Adam’s honours project involves studying changes in Antarctic ice floe geometry. “It’s
exciting, it’s new and there’s an incredible amount
of potential to cross fields: glaciology, oceanography, meteorology,
microbiology – they’re all relevant to the project.” Find out more about Adam's project Keywords: Antarctica, ice floes, glaciology, oceanography, meteorology, microbiology. Adam’s project is another step on a long path to understanding what happens within the pack ice zone in Antarctica. A lot of work has been done on the area of oceans covered by sea ice each year, and how that area varies between seasons, years or even decades. The physical characteristics of sea ice are also the subject of a lot of research – from the ice’s physical structure and chemical composition to its thickness. It is important
to understand all of these things because sea ice has a large role
to play in global climate variability. Each winter, up to 10% of
the world’s oceans are covered by sea ice - making the planet
a lot more reflective and altering its ability to absorb solar radiation.
Sea ice is also an effective insulator between the ocean and the
atmosphere. Given that global climate is really driven by interaction
between the oceans and the atmosphere, it is important to know what
happens when contact between the ocean and The size of
ice floes is related to how thick they are, and how much ice is
in them. A very big ice floe is generally thicker than a small one,
and contains more ice. If scientists like Adam can find out how
many floes of different sizes occur in different conditions, then
they can help to understand out how ice volume is distributed around
the surface of the ocean. Also, most of the time there are gaps
in the ice - and knowing For his research, Adam is analysing digital aerial images of sea ice using software developed at IASOS. He is also helping to develop the software further as his research progresses. The sea ice images come from Ice Station Polarstern [ISPOL], an experiment in the Weddell Sea in late 2004, co-ordinated by the Alfred Wegener Institute in Germany. “I have three sets of images to analyse,” says Adam. “In addition, I will be using weather information and some ice drift information to build a picture of how the general size of ice floes changed over time, and what might have caused the changes.”
All of the images that Adam is using were obtained scientists from the Australian Antarctic Division (AAD). The weather data was collected from a German research vessel, and the ice drift data comes partially from Finland - and the rest from the AAD. It’s a very collaborative project! Useful Websites: For more information and great ideas for classroom activities, visit:
|
|||||||||||||||

